Step-by-step guidance from opening the Strategy Center to analyzing signals and finding high-probability trades
Go to the Strategy Center
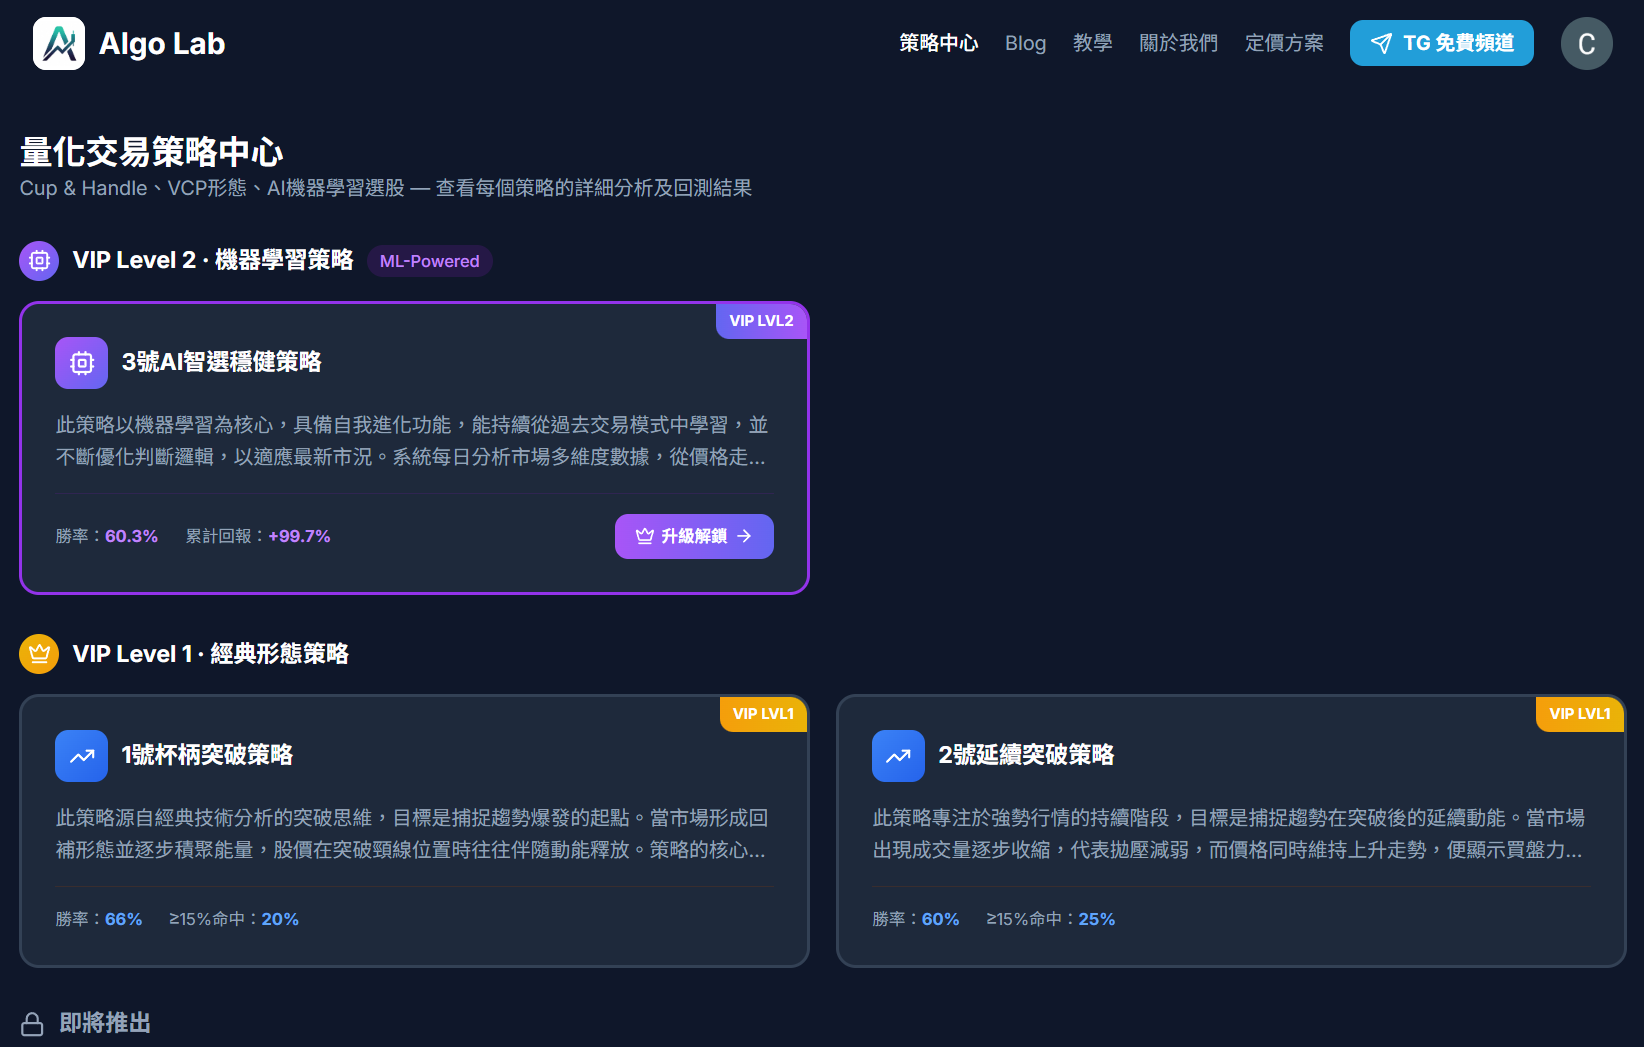
After logging in to algolabhk.com, go to the Strategy Center to view the latest trading signals.
Currently Strategy 1, Strategy 2, and Strategy 3 are available. We will use Strategy 1 as a demonstration.
Interface Navigation Guide
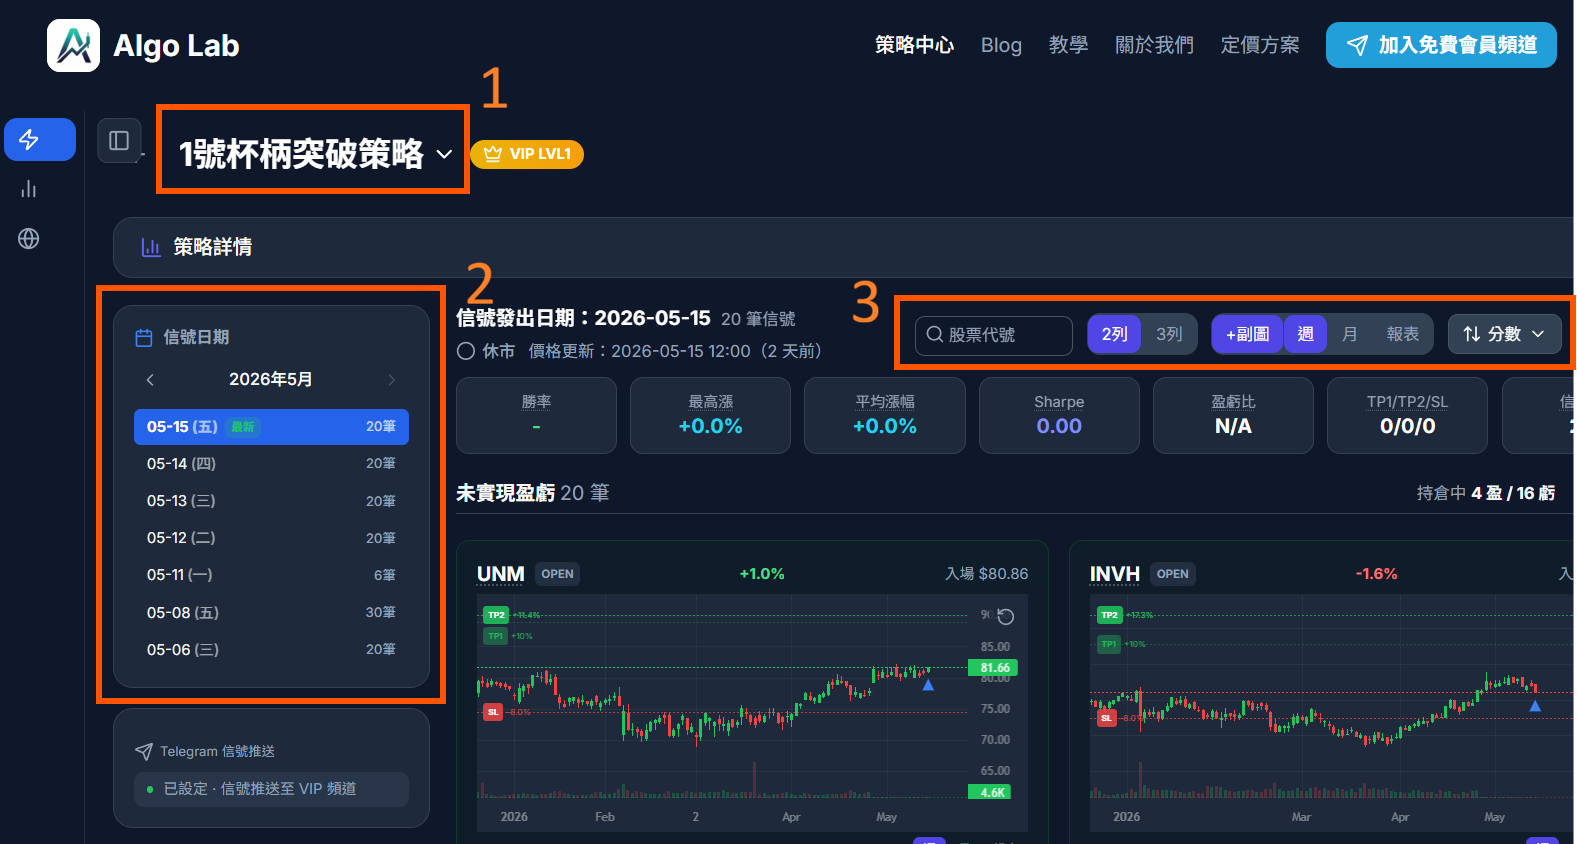
When you enter the Strategy Center, you will see three main operational areas:
1. Top Left: Quick Strategy Switching
Click the dropdown menu at the top left to quickly switch to other available strategies.
2. Signal Date Selection
- VIP Members: Can view the latest same-day signals
- Free Members: Can only view signals from 7 days ago
Click on the latest date to view the most recently generated signals. Signals are typically updated around 4:00 PM Hong Kong Time each trading day. You can also click on past dates to review historical signals and performance.
3. Top Right Function Buttons
The top right provides several useful features:
Side Chart
Click the chart button at the top right to open the Side Chart, displaying the stock's price chart.
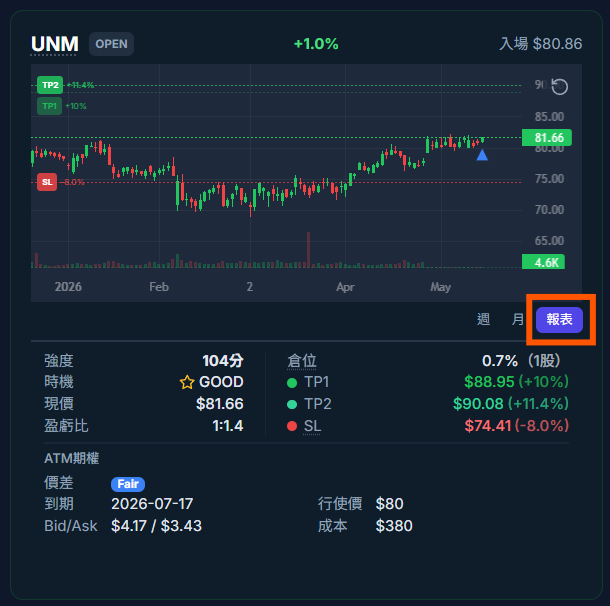
Report
Click the Report button to view detailed signal data for each stock:
- Entry Price: Suggested buy price
- Stop Loss: Suggested stop loss price
- Take Profit: Suggested profit target price
- Position Suggestion: Recommended position size based on risk management
- Signal Strength: System confidence indicator for that signal
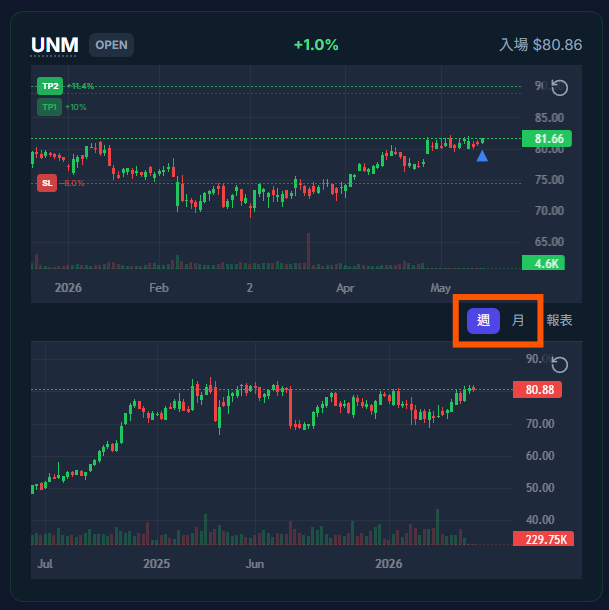
Weekly and Monthly Chart Analysis
In addition to the daily chart, we recommend also opening the Weekly Chart to assess the overall direction:
- Weekly Chart: Observe medium-term trends and confirm whether the signal aligns with the broader trend
- Monthly Chart: Can also be useful at times, especially for identifying long-term support/resistance levels
💡 Analysis Tip
If the signal direction (buy) aligns with the weekly trend (uptrend), the signal's success rate tends to be higher. Conversely, if the signal goes against the major trend, extra caution is advised.
View Stock Fundamentals
When you encounter an unfamiliar stock, hover over the stock ticker to view its basic information:
The popup information includes:
- Company Name: Full name of the stock
- Market Cap: Total market capitalization of the company (very important!)
- Industry: The sector it belongs to
- Exchange: The stock exchange it is listed on
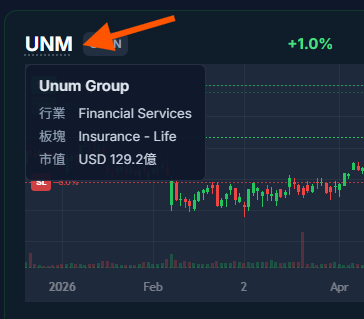
📊 Why Is Market Cap So Important?
Market cap reflects a company's size. Large-cap stocks (e.g., Apple, Microsoft) typically have lower volatility and lower risk; small-cap stocks have higher volatility, with both higher potential returns and higher risk. Understanding market cap helps you better assess the risk of each trade.
Subjective Analysis: Finding Short-Term Breakout Opportunities
In addition to system signals, you can also add your own analysis to evaluate which stocks are more likely to experience short-term breakouts.
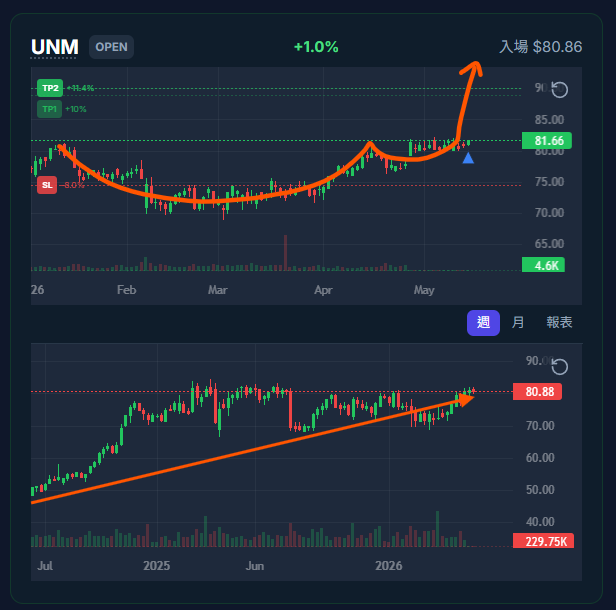
Pattern Analysis (Using Strategy 1 as an Example)
UNM shows a clear Cup and Handle pattern, with prices steadily rising and forming Higher Lows — a classic sign of strength.
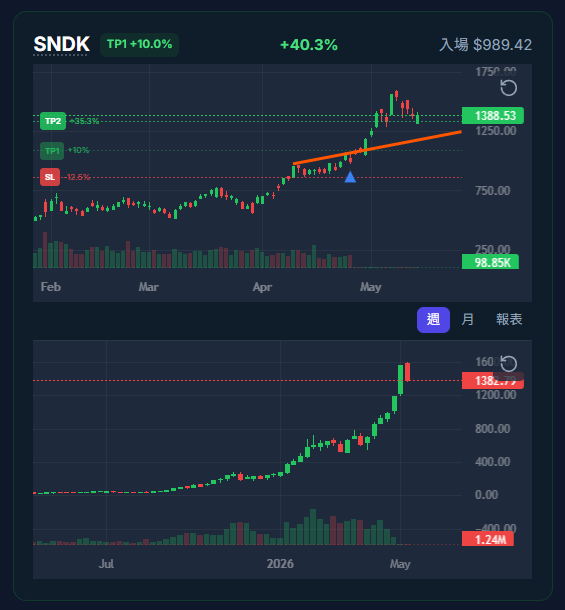
Pattern Analysis (Using Strategy 2 as an Example)
SNDK is at an All-Time High, with prices consolidating in a tight range and making small advances — indicating strong institutional buying interest. Once it breaks through the critical level, a breakout is expected.
Suggested Analysis Steps
- Review Historical Signals: Click on past dates to observe which signals were profitable after being issued
- Look for Patterns: Review multiple times and you will notice certain patterns or formations recurring
- Assess Short-Term Catalysts: Are there upcoming earnings reports, product launches, or industry news?
- Compare Signal Strength: Prioritize stocks with higher signal strength
Daily Analysis Workflow Summary
Below is a complete daily analysis workflow:
| Step | Action | Time Required |
|---|---|---|
| 1 | Go to the Strategy Center, select the latest date | 1 minute |
| 2 | Open Side Chart and Report, review signal data | 5 minutes |
| 3 | Open Weekly Chart, assess overall direction | 3 minutes |
| 4 | View fundamentals and market cap of unfamiliar stocks | 2 minutes |
| 5 | Add subjective analysis, identify the most promising stocks | 5 minutes |
Total: approximately 15-20 minutes per day. You can also check the Market Pulse to understand the market environment before analyzing signals to complete your daily signal analysis.
Key Takeaways
- The [Strategy Center](/strategy) is the main entry point for viewing signals. Strategy 1 through 3 are currently available
- Select the latest date on the left, open Side Chart and Report from the top right
- Always open the Weekly Chart to assess overall trend direction
- Hover over a stock ticker to view fundamentals and market cap
- Combine system signals with subjective analysis to improve trading decision quality